Examining the call graph
If you are interested in seeing all calls to or from a certain function in your application, Call Graph is a tool for you.
Call Graph is available in IAR Embedded Workbench for a number of architectures (we will use Renesas RX as example in this text). This feature produces a static call graph based on symbol information in your active project.
To display a call graph, select a function name in the editor window (or in the Source Browser window), right-click and select either Find All Calls to or Find All Calls from the context menu.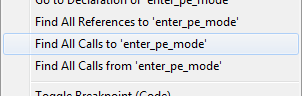
The Call Graph window will open (also available via the View menu) and display the call graph for the selected function.
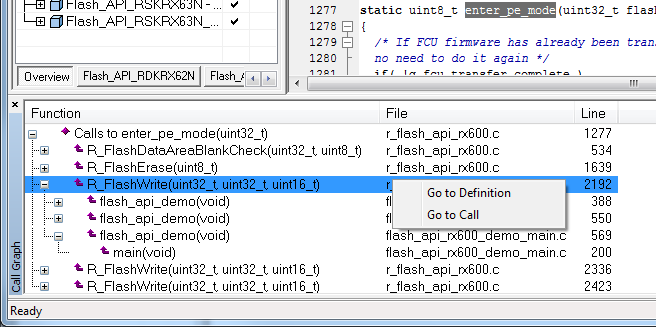
Each line in the window represents a function and an arrow is indicating the call chain direction. If calls are made to any entry in the window, it is possible to expand that entry to see all calls made to the function it represents. Double-clicking an entry will take you to the location of the function call. Via the context menu, you can also navigate to the function definition of the calling function. The hierarchical view that the Call Graph window offers also makes it easier to see the structure of your code.