How to find hard-to-find bugs in Arm Cortex-M3 and -M4 applications
Debugging is always a large part of developing and most developers today have access to a JTAG/SWD debug probe, which is often sufficient for basic debugging tasks. However, the relatively low-cost trace probes available gives the developer even further possibilities for understanding what the application is doing, and makes debugging difficult situations a whole lot easier.
If you have chosen to work with a device based on the Arm Cortex-M3 or -M4 core, you can gain a lot from its useful on-chip debug logic, which in combination with a capable debugger enables you to examine the application’s behavior from various angles.
The debug architecture consists of five main units as described by Figure 1. Some of these, like the Embedded Trace Macrocell (ETM), are optional so you may need to check which have been implemented in your device.
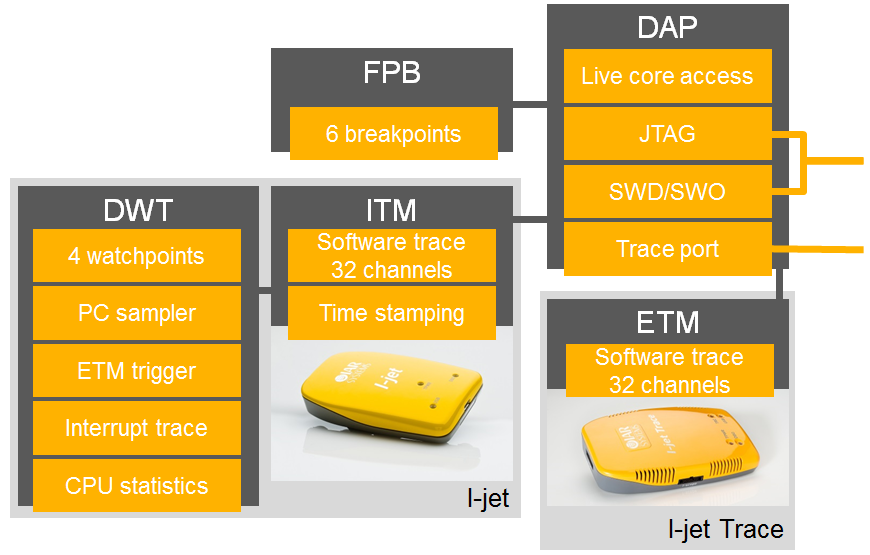
Figure 1. The debug architecture of the ARM Cortex-M3 and M4 devices
SWO trace
The Instrumentation Trace Macrocell (ITM) is a lightweight trace that provides selected trace data over a low speed access port. Instrumentation trace is available using a debug probe such as I-jet, a low-cost probe that every developer should have on his or her desk. The ITM provides 32 channels for software trace that can be used by the software to generate packets for distribution to the debugger over SWO. This can be used for instrumentation of the code with very little overhead as the core does not need to stop to output the message or data. All that is needed is a single write operation to one of the 32 ITM stimulus registers. On the other hand, far from every instruction is traced.
The ITM also takes care of trace events triggered by another unit, the Data Watchpoint and Trace (DWT). The DWT provides a set of functions that collect information from the system buses and generates events to the ITM for packetizing and time stamping and further distribution on the SWO channel.
There are four independent comparators, or watchpoints, in the DWT that can generate an event on an address match or a data match. They can be used for various purposes, including triggering the ETM, triggering an ITM packet, or breaking the code at certain conditions. Setting one of the four watchpoints to trigger the ETM is useful when debugging applications that run for a longer time, as it makes it possible to set not just plain trace start and stop breakpoints that starts and stops the trace data collection at specified addresses, but also to set complex trace start and stop conditions that, for example, could be based on when a variable reaches a certain value.
The DWT also provides an interrupt trace function and a PC sampler that samples the program counter register at regular intervals. As the sampling is likely to miss most instructions that are executed, it will not be able to give a complete view of the applications whereabouts, but it will be able to provide information about in which functions the application has spent its time.
Embedded Trace Macrocell
ITM and DWT are very useful and may be sufficient for most embedded projects, but sometimes you will need an even more powerful debug mode to get down to the most difficult problems. Tracing every single executed instruction, the Embedded Trace Macrocell (ETM) provides you with unmatched insight into the microcontroller’s activities and enables you to find those hard-to-find bugs that are difficult or even impossible to find any other way.
To use ETM, you need a special trace debug probe that can store the instructions in its memory. The number of instructions, or rather samples, possible to store is of course limited by the size of that memory. IAR Systems trace probe I-jet Trace for Arm Cortex-M reads trace data 4 bits at a time, this is what is called a sample. 4 bits is the standard trace width on Arm Cortex-M devices. I-jet Trace has a large trace memory capacity of up to 32 Msamples but since the ETM protocol is compressed, there is no one to one mapping of number of samples to number of instructions. The maximum number of instructions per sample occurs for completely linear execution (no jumps or branches in the code) and is 7.5. The average is around 2 instructions per 4-bit sample.
Unlike the event trace provided by the DWT and ITM, the ETM will let you know what your application was doing before it received an interrupt, what it is doing while the ISR is executing, and what happens after it leaves the interrupt. It will tell you where the application has been and exactly how it got there. In short, it will give you full insight to your applications behavior in real-time without being intrusive.
The most obvious way to use trace data in debugging situations is to look backwards in time, for instance when tracking a program where execution goes askew. You can stop execution after the program has deviated, and examine the trace output to see where it went wrong.
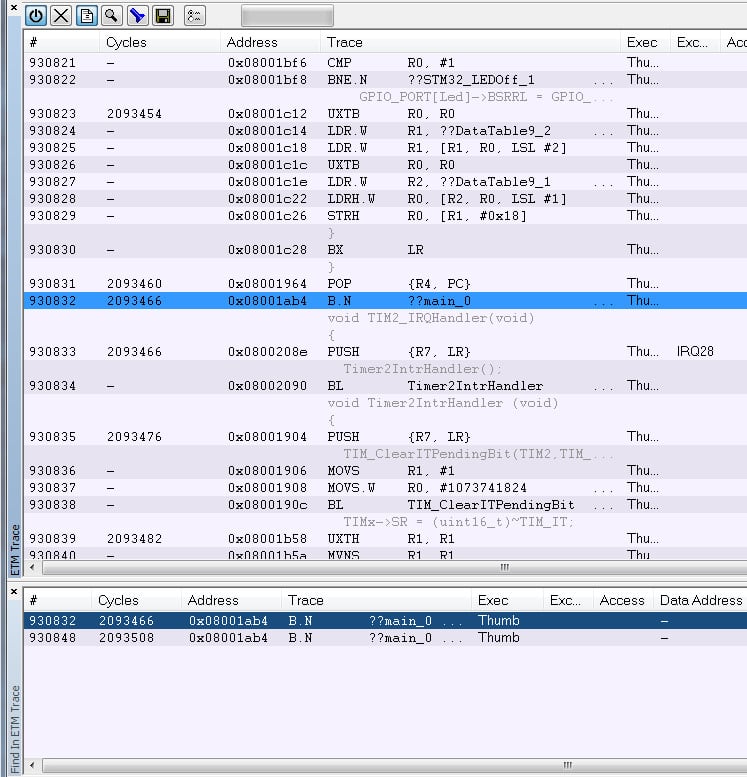
Figure 2: Searching in the ETM trace output in IAR Embedded Workbench
In addition to the most straight-forward way of using trace, to go back and examine execution, there is other useful functionality that is enabled by using ETM trace. Code coverage analysis supplies information on which parts of your code have been executed and which have not. This information is extremely helpful during testing, since it enables you to ensure all parts of your code have been tested. Function profiling shows you the amount of time being spent in each function, helping you decide where to put most effort in code optimizations and improvements. Function profiling using the sampled SWO trace can also be useful, but is based on a statistical profile instead of the full trace data available with ETM trace.
All of the above mentioned functionality is available in IAR Embedded Workbench, and is enabled by using a trace probe equipped with ETM trace, such as I-jet Trace.