How to measure execution time with CYCLECOUNTER
IAR Embedded Workbench is an integrated development environment which supports a wide range of microcontrollers. The C-SPY Debugger in IAR Embedded Workbench for ARM has functionality to debug and test software.
Cortex-M3/M4 has a DWT (Data Watch and Trace Unit) which includes a clock cycle register (CYCCNT) and C-SPY implements a 64-bit cycle register accordingly, CYCLECOUNTER. This register enables accurate and extended measure execution times and combined with C-SPY macros becomes a very useful instrument in developers’ toolbox.
CYCLECOUNTER display
To show register window when using the C-SPY Debugger, select [View] => [Register].Select [CPU Registers] from Register Filter to show “CYCLECOUNTER”. There are three registers which are related with CYCLECOUNTER: CCTIMER1, CCTIMER2, and CCSTEP. When an instruction is stepped and the execution is stop, the values of these four registers are updated. CCSTEP is interval clock cycles between previous break and recent break. CYCLECOUNTER, CCTIMER1 and CCTIMER2 show accumulated clock cycles. A difference between CYCLECOUNTER and CCTIMER1/CCTIMER2 is that the value of CCTIMER1/CCTIMER2 can be modified by user, in contrary with the value of CYCLECOUNTER and CCSTEP that cannot be changed by users. One of simplest ways to measure the execution time is to read these values with user breakpoints.
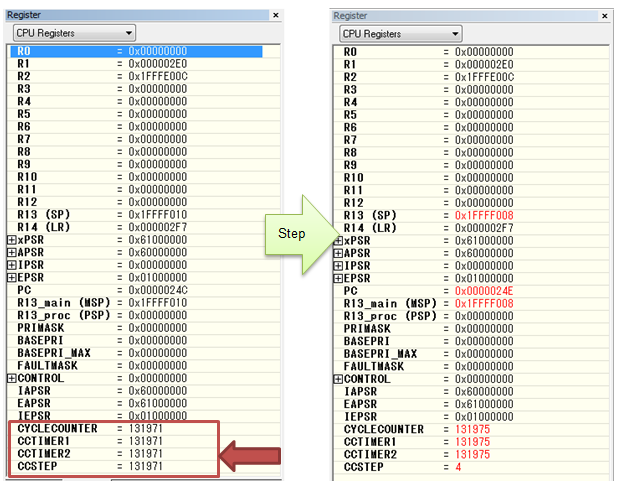
Execution time with register window
When you want to measure execution time from one point to another in the source code, you must remember the previous value of CYCLECOUNTER and get the new value and calculate the execution time by subtracting for the value of CYCLECOUNTER is accumulating.
Before program start, set one use breakpoint as start, and one user breakpoint as stop.
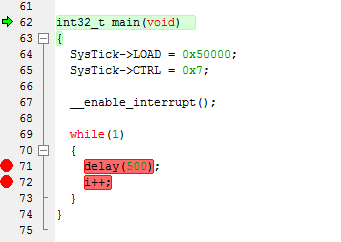
When program stops at the start breakpoint, the value of CCTIMER1 should be cleared to zero.
When program stops at the stop breakpoint, the value is the execution time. C-SPY has two cycle counters CCTIMER1 and CCTIMER2 to measure execution cycles.
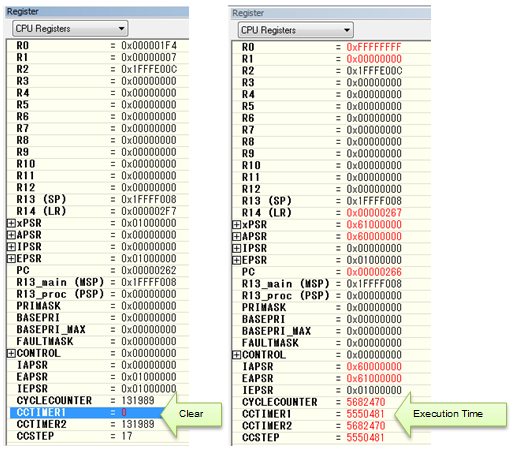
Automatic measuring with C-SPY macros
C-SPY has a macro system that can be used to make the testing process more efficient. These macros can automate execution time measurement with CYCLECOUNTER and CCTIMER. As an example, we can implement two macro functions, “Clear_TIMER1” and “Dump”.
Clear_TIMER1(  ) {
     #CCTIMER1 = 0 ;
     __message "reset CCTIMER1=", #CCTIMER1;
}

Dump( )  {
  __message "CYCLECOUNTER=", #CYCLECOUNTER;
  __message "CCTIMER1=", #CCTIMER1;
}
We save this text file as “cycle.mac” and browse to the file from [Project] => [Options…] => [Debugger] => [Setup].
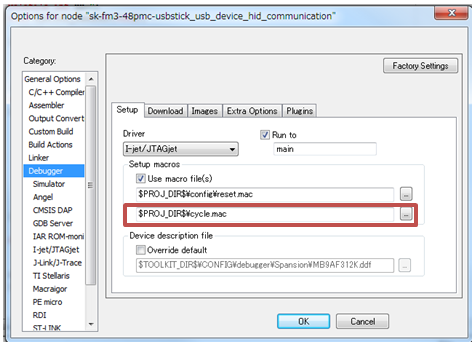
After this, set two breakpoints where you want to measure execution cycles. Select [View] => [Breakpoints] to open the [Breakpoint] window.
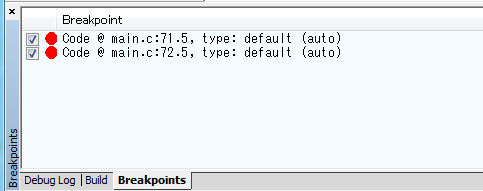
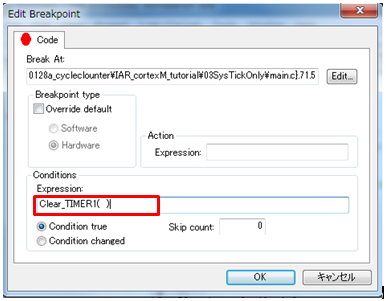
In [Breakpoints] window, select the start breakpoint and right-click the breakpoint. Then select [Edit..], and input “Clear_TIMER1( ) ” at the Expression field.
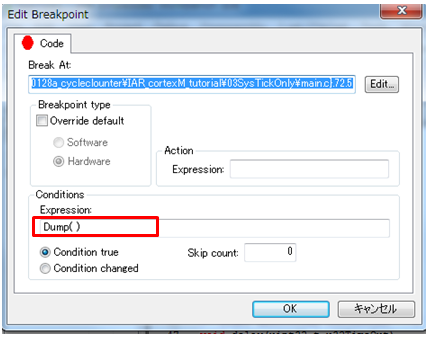
Select the stop breakpoint and right-click the breakpoint. Then select [Edit..], and input “Dump( )” at the Expression field
Execution result
After these settings, we can start the execution. When we start execution, the messages are shown in the [Debug log] window. The output messages can in addition be copied and pasted for further processing.

Conclusion
There are multiple ways of measuring execution times on Cortex-M3/M4 processors. CYCLECOUNTER which is supported by IAR Embedded Workbench for ARM enables us to measure high-precise and long execution time. Furthermore, if we combine C-SPY macro and CYCLECOUNTER, this useful measurement is automated. There are only two cycle counter register, CCTIMER1 and CCTIMER2, but if we use C-SPY macros, we can increase the number of measurement points.