Power Debugging
Power Debugging provides developers with information about how the software implementation of an embedded system affects the system’s power consumption.
IAR Systems' power debugging technology samples the momentary current drawn by the system and feeds it to a power debug API where it is synchronized with time stamped debug information. This connects power consumption directly to the source code.
- Power consumption visualized as a power graph in the Timeline window
- Power profiling on function level
- Source code correlation
- Detailed information about power samples displayed by the Power log window
- Power breakpoints
- Power samples can be filtered
Power graph
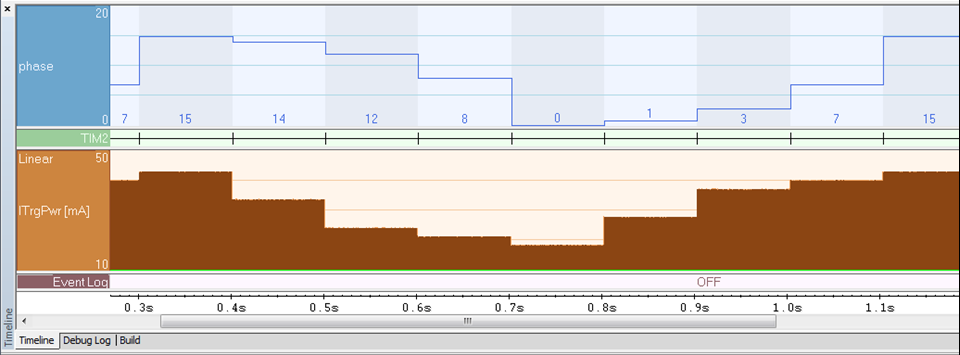
The power graph shows a visualization of the power consumption on a common timeline together with interrupt activity and selected variable values. The power graph provides a graphical correlation of system events and power consumption that is easy to understand also when the system itself is very complex.
Power profiling
In addition to showing how many clock cycles have been spent by each function or task, the function profiler in IAR Embedded Workbench also shows how much power has been spent by each function. The power profile is based on sampled power data to provide statistical data. It displays energy percentage, average, min and max values of the current comsumption. The power profiler can be used for pinpointing where the software can be optimized for lower power consumption.
Power log
The Power log window provides a detailed textual log of all power samples together with timestamps and PC values.
Correlation with the running application
The correlation between power samples and source code makes it possible to click in the Power graph displayed or in the power log window to highlight the corresponding source code statement in the editor window as well as in the disassembly window.
Power breakpoints
The debugger can stop the execution if a logged power consumption value is either above or below a user defined threshold value.
Filtering
Power samples can be filtered based on a user defined threshold value, making it possible to log only samples matching the specified criteria.
Availability
The technology is available for Arm Cortex cores. To enable Power Debugging on a supported device, it needs to be connected to the debugger through a supporting debugging probe such as I-jet. The power measurement capabilities can be extended by also using I-scope.