Watch and graph variables over time with Sampled graphs
A common need when debugging is to watch and graph a variable over time. It may be useful to watch the values obtained by an analog to digital converter, USART or other source which constantly changes.
The Sampled Graph allows you to do that without having to pause the program execution. There are three windows available from the emulator menu: data sample, data sample setup and sampled graphs.
To sample a certain variable, you can drag and drop it from the source file to the data sample setup window.
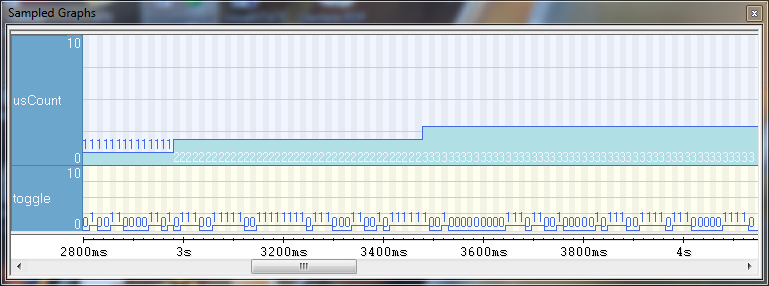
Right-click in the data sample and click enable to start the collection of data samples. Right click the data sample section in the sampled graphs window and click enable to start graphing. Click go in the debugger and you’ll see the following captured in real time.
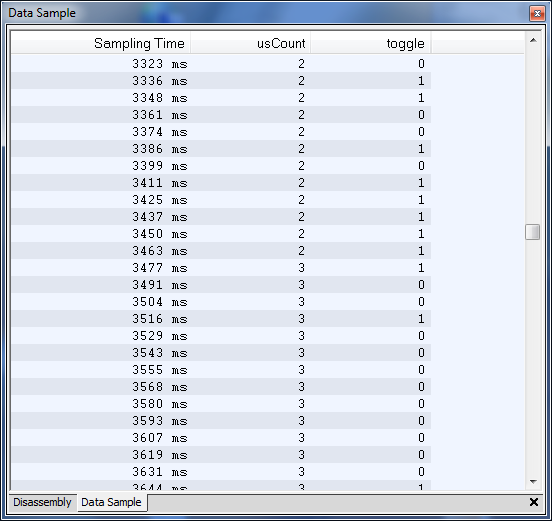
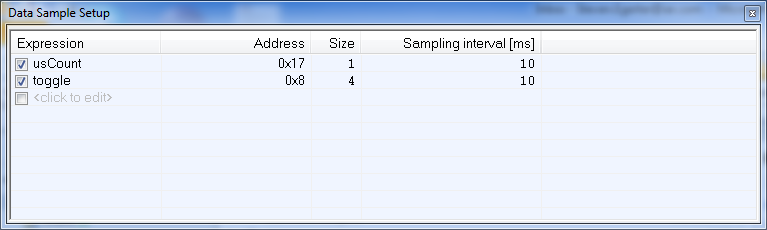
The data sample window shown here displays the expression or variable name, the address of the variable, the size in bytes of that variable and the sampling interval which in this case is fixed at approximately 10 ms.
To save this data to a log file, right-click in the data sample window and select "save to log file …", browse to the desired location and click save. Once the log file has been saved, the data can be imported into Microsoft Excel for further processing.
Sampled graphs are available for many different targets using IAR Embedded Workbench. The images in this article were taken from IAR Embedded Workbench for RX. If you are using IAR Embedded Workbench for ARM, similar functionality is available through the Timeline window.