Find the stack usage of your application with IAR Embedded Workbench for RX
In version 2.60 of IAR Embedded Workbench for RX, stack usage analysis is introduced. In this article, we will take a look at this functionality and introduce some techniques on how to calculate the maximum stack usage of your application at building time, as well as track the signs of stack pointer at runtime.
Background
The stack is a fixed block of continuous memory and has to be allocated statically by the developer. It contains local data for C/C++ functions, e.g.:
- Local variables which are not stored in registers
- Function parameters which are not stored in registers
- Temporary result of expressions
- The return value of a function (unless it is passed through registers)
- Interrupt contexts
- Processor registers that should be restored before the function returns
A stack can be divided into two parts. The first part contains allocated memory used by functions and the second part contains free memory that can be allocated. The border between them is called the top of stack and is represented by the stack pointer (SP), which is a dedicated processor register in usual. Memory is allocated from the stack by moving SP. The memory allocated on the stack is released when the function returns, so it is impossible to store data which is supposed to live thereafter.
The main advantage of stack is that functions in different parts of the application can share the same memory space to store their data. Unlike a heap, the stack will never become fragmented or suffer from memory leaks.
A proper configuration of the stack is essential to your system stability and reliability. If the stack size is too small, SP might be moved out of the stack area thus an overflow situation occurs. In this case, the executing code could write to the area allocated below the stack (in case the stack grows downwards) and lead to a serious runtime failure like overwritten variables, wild pointers, corrupted return address, etc. On the other hand, setting the stack size too large means a waste of RAM resource which could be very limited in MCU-based embedded systems.
Static stack usage analysis
Under the right circumstances, the linker can accurately calculate the maximum stack usage for each call graph root (a function that is not called from any another functions). A stack usage chapter will be added into the linker map file, listing the depth of the deepest call chain for each call graph root, as well as the sum of deepest call chain depths for each call graph root category. The calculation is only accurate if there is enough stack usage information for each function in the application.
Usually, the compiler will generate this information for each function. But in some cases, additional directives have to be provided by the developer to inform the compiler about indirect calls (calls using function pointers) or the maximum number of iteration for recursive functions. This can be achieved by either using #pragma directives in the source code or specifying a separate stack usage control file in the project options dialog.
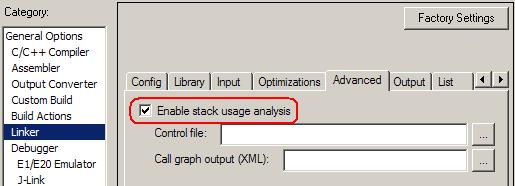
Enable stack usage analysis
In the Advanced tab of Linker options, check Enable stack usage analysis:
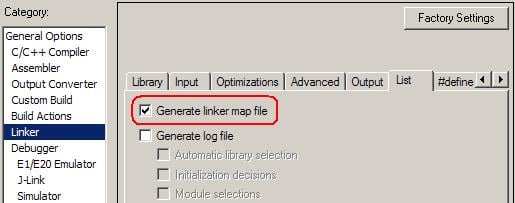
And don’t forget to generate a linker map file, since it contains the result of stack usage analysis. It can be enabled in the List tab of Linker options:
For simple applications, the result of stack usage analysis is plain and easy to understand. In usual, the program entry and interrupt handlers would be regarded as call graph root since they are not called by any other functions. In the example below, the maximum stack depth is 288 bytes for the Program entry call graph root category (__iar_program_start) and totally 120 bytes for the interrupt call graph root category (__interrupt_170 and _default_handler).
*************************************************************************
*** STACK USAGE
***

Call Graph Root Category  Max Use  Total Use
------------------------  -------  ---------
interrupt                     120        120
Program entry                 288        288

Program entry
  "__iar_program_start": 0xffffb14c

Maximum call chain                                288 bytes
    "__iar_program_start"                             4
    "_main"                                           8
    "_printf"                                         8
    "__PrintfFullNoMb"                              152
    "__LdtobFullNoMb" in xprintffull_nomb.o [4]      80
    "__GenldFullNoMb" in xprintffull_nomb.o [4]      36

interrupt
  "__interrupt_170": 0xffffaa22

Maximum call chain                                52 bytes
    "__interrupt_170"                               52

interrupt
 "_default_handler": 0xffff98cb

  Maximum call chain                                68 bytes

    "_default_handler"                              52
    "_abort"                                         4
    "__exit"                                        12
Specify indirect calls
An indirect call means calling a function through a function pointer. Since the callee function is unknown at building time, the linker cannot automatically retrieve the stack usage information for indirect calls. A warning message will be generated by the linker, for example:
Warning[Lo009]: [stack usage analysis] the program contains at least one
indirect call. Example: from "_BSP_IntHandler" in bsp_int.o [1]. A
complete list of such functions is in the map file.
In the STACK USAGE chapter of the linker map file, there is the description:
The following functions perform unknown indirect calls:
 "_BSP_IntHandler" in bsp_int.o [1]: 0xffffabd4
Note: To comply with Renesas RX ABI, the compiler generates assembler labels for symbol and function name by prefixing an underscore. So that the label “_BSP_IntHandler” here actually stands for the function BSP_IntHandler().
To solve this problem, the developer should use the #pragma calls directive to list the functions that could be indirectly called by a statement. This directive should be inserted just before the indirect call statement and specify the list of all possible callee functions. For example, the following code specifies that the function UartRxHandler(), UartTxHandler() and UartFaultHandler()could be indirectly called through the function pointer isr():
void BSP_IntHandler (int int_id) {
void (*isr)(void);
……
    if (int_id < BSP_INT_SRC_NBR) {
        isr = BSP_IntVectTbl[int_id];
#pragma calls=UartRxHandler,UartTxHandler,UartFaultHandler
        isr();
}
……
}
Provide call graph root information
In a multi-task environment using RTOS, the root function of each task is also a call graph root. Sometimes they are not able to be automatically identified by the linker. The linker will generate warning messages instead because it seems that they are not called by any other functions:
Warning[Lo008]: [stack usage analysis] at least one function appears
to be uncalled. Example: "_App_TaskJoy" in app.o [1].
A complete list of uncalled functions is in the map file.
In the STACK USAGE chapter of the linker map file, there is the description:
Uncalled function
"_App_TaskJoy" in app.o [1]: 0xffff992c
……
Uncalled function
"_App_TaskLCD" in app.o [1]: 0xffff9988
……
Uncalled function
"_App_TaskButton" in app.o [1]: 0xffff99f6
……
To solve this problem, the developer should use the #pragma call_graph_root directive to identify the particular function as a call graph root. For example:
#pragma call_graph_root="task"                          // task category
static void App_TaskJoy (void *p_arg)
{ …… }
#pragma call_graph_root="task"                          // task category
static void App_TaskLCD (void *p_arg)
{ …… }
#pragma call_graph_root="task"                       // task category
static void App_TaskButton (void *p_arg)
{ …… }
#pragma call_graph_root="interrupt" // interrupt category
void OS_CPU_SysTickHandler (void)
{ …… }#pragma call_graph_root="task" // task category
static void App_TaskJoy (void *p_arg)
{ …… }
#pragma call_graph_root="task" // task category
static void App_TaskLCD (void *p_arg)
{ …… }
#pragma call_graph_root="task" // task category
static void App_TaskButton (void *p_arg)
{ …… }#pragma call_graph_root="interrupt" // interrupt category
void OS_CPU_SysTickHandler (void)
{ …… }Actually, it is possible to use any string other than task or interrupt to be the name of call graph root categories. The compiler will automatically assign a call graph root category to interrupt and task functions.
Use a stack usage control file
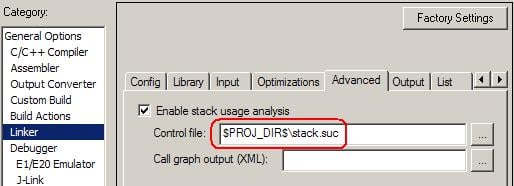
The #pragma directives have to be inserted into source files, which are not allowed in some cases. Without changing the source code, a separate stack usage control file can alternatively provide the same stack usage information to the compiler and linker.
The stack usage control file is a text file which has *.suc as its suffix. The path of stack usage control file can be set in theAdvanced tab of Linker options:
There are several types of directive that can be used in the stack usage control file, such as function, exclude, possible calls, call graph root, max recursion depth, no calls from, etc. The possible calls directive has the similar effect as #pragma calls, which specifies the possible callee functions of an indirect call. The call graph root directive has the similar effect as #pragma call_graph_root, which identifies a group of none-called functions as call graph root.
Replacing the #pragma directives used in previous examples, the content of a stack usage control file is shown below. Note: The underscore prefix is still required for labels here.
call graph root [task] : _App_TaskJoy [app.o];
call graph root [task] : _App_TaskLCD [app.o];
call graph root [task] : _App_TaskButton [app.o];
call graph root [interrupt] : _OS_CPU_SysTickHandler;possible calls _BSP_IntHandler : _UartRxHandler, _UartTxHandler,
_UartFaultHandler;Specify the iteration of recursive functions
A recursive function calls itself either directly or indirectly. Each invocation can store its own data on the stack. If it is not properly designed to return after several iterations, there is a high risk to cause stack overflow.
Since the actual number of iteration is unknown at building time, the linker cannot automatically retrieve the stack usage information for recursive functions. A warning message will be generated by the linker, for example:
Warning[Lo010]: [stack usage analysis] the program contains at least
one instance of recursion for which stack usage analysis has not been
able to calculate a maximum stack depth. One function involved is
"_GLCD_SendCmd. A complete list of all recursion nests is in the map file.
In the STACK USAGE chapter of the linker map file, there is the description:
The following functions make up recursion nest 0, which has no
maximum recursion depth specified:
"_GLCD_SendCmd": 0xffff8aacTo solve this problem, the developer should use the max recursion depth directive in a stack usage control file to specify the maximum recursion depth for each recursive function. Stack usage analysis will base its result on the maximum number of iteration multiplied by the stack usage of the deepest cycle in the recursion nest. The example below sets the maximum recursion depth to 3 for the function GLCD_SendCmd():
max recursion depth _GLCD_SendCmd : 3;Runtime stack usage tracking
Static stack usage analysis calculates the theoretical maximum stack requirement at building time. However, the actual stack consumption can be various during execution. IAR Embedded Workbench for RX provides another approach to track the stack usage at runtime, implemented by the C-SPY debugger. C-SPY can fill the entire stack area with a magic data pattern, for example 0xCD, before the application starts to execute. After the program has been running for a while - preferably under certain test conditions - the stack memory can be checked upwards from its end until finding a value that is different from 0xCD, which is assumed to be the utmost location where SP has ever reached. The part of stack memory that still contains 0xCD has never been overwritten, so that it is safe to reduce the stack size by that amount. Of course, it could be wise to reserve a little extra space just in case your test didn't last long enough or didn’t accurately reflect all possible runtime scenarios.
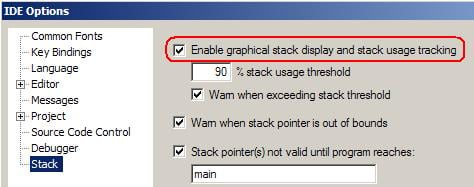
Check Enable graphical stack display and stack usage tracking in the Stack category of the IDE Options dialog to enable the runtime stack usage tracking:
The Stack window is available from the View menu. Whenever the execution stops, C-SPY can update the graphical representation of stack usage in this window:
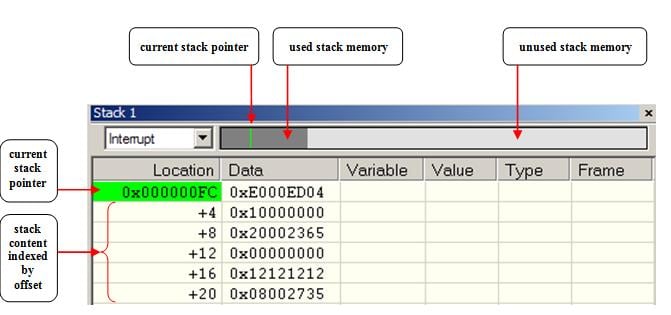
The left end of the graphical stack bar represents the bottom of stack - the position of SP when the stack is empty. The right end represents the end of memory space reserved for stack. The dark grey area represents the used stack memory and the light grey area represents the unused stack memory. The graphical stack bar turns red when the stack usage exceeds a threshold which you can set in the IDE Options dialog.
Note: This functionality cannot detect a stack overflow when it happens, but can only detect the signs it leaves behind. Although this is a reliable way to track the stack usage, there is no guarantee that a stack overflow could be detected. For example, a stack can incorrectly grow outside its bound and even modify memory outside the stack area, without actually modifying any bytes near the border.